Suppose you run an experiment and are interested in an estimate of the average treatment effect (ATE) for the full sample as well as sub-groups. An annoying aspect of coding this up is that you end up repeating a lot of code. Programming guides tell us that we should write a function, but if you are like me and reach for the tidyverse you have another problem: non-standard evaluation. It is the bane of my existence because all of the reason that dplyr is so great to use outside of functions makes it a pain to use within a function.
In the spirit of notes to myself, here’s an example of taking advantage of rlang and purrr to deal with the problem of non-standard evaluation when filtering data to run an experiment.
What’s the problem?
In short, the way that dplyr evaluates with tidy evaluation, a special type of non-standard evaluation.1 A verb like filter() uses data masking so that we can use data variables as if they were environmental variables.
df <- tibble(
    a = c(1,2,3),
    b = c("A","B","C")
)
## Without data masking
df[df$b == "B",]
## With data masking
df |>
filter(b == "B")This is great for working with data outside of functions because it requires less typing. Unfortunately, it also means that if we use filter() inside a function we write then we need to inject the data-masked argument. Injection is a metaprogramming feature for modifying parts of a program.
In short, the following function call does not work.
f <- function(df, v1, cond){
    dplyr::filter(.data = df, v1 == cond)
}
## This will break
f(df, b, "B")
What does work? Something like this
f2 <- function(df, cond){
    dplyr::filter(.data = df, {{cond}})
}
Now passing our filter condition works as expected.
f2(df, b == "B")| a | b |
|---|---|
| 2 | B |
More generally, if we want to pass arbitrary number of conditions
f3 <- function(df, ...){
    dplyr::filter(.data = df, ...)
}
We can now pass multiple filter conditions.
f3(df, b == "B" | a == 1)| a | b |
|---|---|
| 1 | A |
| 2 | B |
What if I have a lot of expressions?
Note that typing all of those individual expressions within a function argument is asking for failure. Furthermore, what if we want to use this function later for something else? It would be nice to pass a set of expressions to our function. Enter rlang and the injection operator.
The injection operator (!!) injects a value or expression into another expression before R evaluates the code. Every data-masking verb in the tidyverse supports injection. To deal with lots of expression at once, we make use of the symbolize and inject pattern.
f4 <- function(df, expr){
    dplyr::filter(.data = df, !!expr)
}
The power of this pattern shows up when we apply it with purrr functional programming. A minimal example:
express <-rlang::exprs(
  a = a != 2,
  B = b %in% c("A", "B"))

purrr::map2_dfr(.x = list(df), .y = express, .f = f4)| a | b |
|---|---|
| 1 | A |
| 3 | C |
| 1 | A |
| 2 | B |
Note that on purpose there’s an extra row created here. This is just to illustrate the pattern.
Using this pattern for ATEs
Let’s return to the original puzzle about using the same data set and being interested in subgroups. Suppose we have a function that will calculate the average treatment effect (ATE) and output the lower and upper bound of the confidence interval.
ate <- function(outcome, treatment){

    ## first get rid of non-missing observations
    treatment <- treatment[!is.na(outcome)]
    outcome <- outcome[!is.na(outcome)]

    treated <- outcome[treatment == 1]
    not_treated <- outcome[treatment == 0]

    N1 <- length(na.omit(treated))
    N0 <- length(na.omit(not_treated))

    ## Calculate the difference in means
    mean_treated <- mean(treated)
    mean_control <- mean(not_treated)
    ate <- mean_treated - mean_control

    ## Standard Error Calculation
    ## Use the usual Neyman Approximation
    var1 <- sum((treated - mean(treated))^2) / (N1 - 1)
    var0 <- sum((not_treated - mean(not_treated))^2) / (N0 - 1)

    ## Take sqrt to get SE
    se_ate <- sqrt(var1/N1 + var0/N0)

    ## Degrees of Freedom calculation
    df_numerator <- (var1/N1 + var0/N0)^2
    df_denominator <- (var1^2/(N1^2*(N1-1))) + (var0^2/(N0^2*(N0-1)))

    degrees_free <- df_numerator/df_denominator

    ## Now plug it in with the inverse
    ## cdf of the t-distribution qt(x, df)
    lwr_bound <- ate - qt(.975, degrees_free)*se_ate
    upp_bound <- ate + qt(.975, degrees_free)*se_ate

    return(c(ATE = ate,
             lwr_bound = lwr_bound,
             upp_bound = upp_bound))
}
Pretend that our data frame looks like the following:
set.seed(1234)
df <- tibble(
    C = c(rep("e",
              100)),
    R = rbinom(100,
               1,
               prob = c(0.5, 0.5)),
    P = rbinom(100,
               1,
               prob = c(0.5, 0.5)),
    treatment = sample(c(rep(0,50),
                         rep(1,50)),
                       100,
                       replace = F),
    outcome = runif(100)*10
)
We can imagine that we ran multiple different types of experiments, or multiple conditions. We also have four subgroups because \(R, P \in \{0,1\}\). That gives five total ATEs we might be interested, the overall and the four subgroups. Using the pattern from above, here’s a functional programming way to get all of them at once.
## filter inside a function
results <- function(df, filters){
    tmp <- df |>
        filter(!!filters) |>
        select(outcome, treatment)

    ate(tmp["outcome"], tmp["treatment"])
}

## filter expressions
groups <- rlang::exprs(
    o = C == "e",
    r0 = C == "e" & R == 0,
    r1 = C == "e" & R == 1,
    p0 = C == "e" & P == 0,
    p1 = C == "e" & P == 1

)

## purrr away
purrr::map2_dfr(.x = list(df),
                        .y = groups,
                        .f = results) |>
    ## Make a coefficient plot
    mutate(condition = c("o", "r0", "r1", "p0", "p1")) |>
    ggplot(aes(x = ATE, y = condition, color = condition))+
    geom_point()+
    geom_vline(xintercept = 0,
               linetype = 2)+
    geom_errorbarh(aes(xmin = lwr_bound, xmax = upp_bound))+
    theme_minimal()+
    xlab("Treatment Effect")+
    ylab("Subgroup")+
    theme(legend.title = element_blank())+
    ggtitle("Example Experiment Runs")+
    ggsave(filename = "~/Desktop/file.png")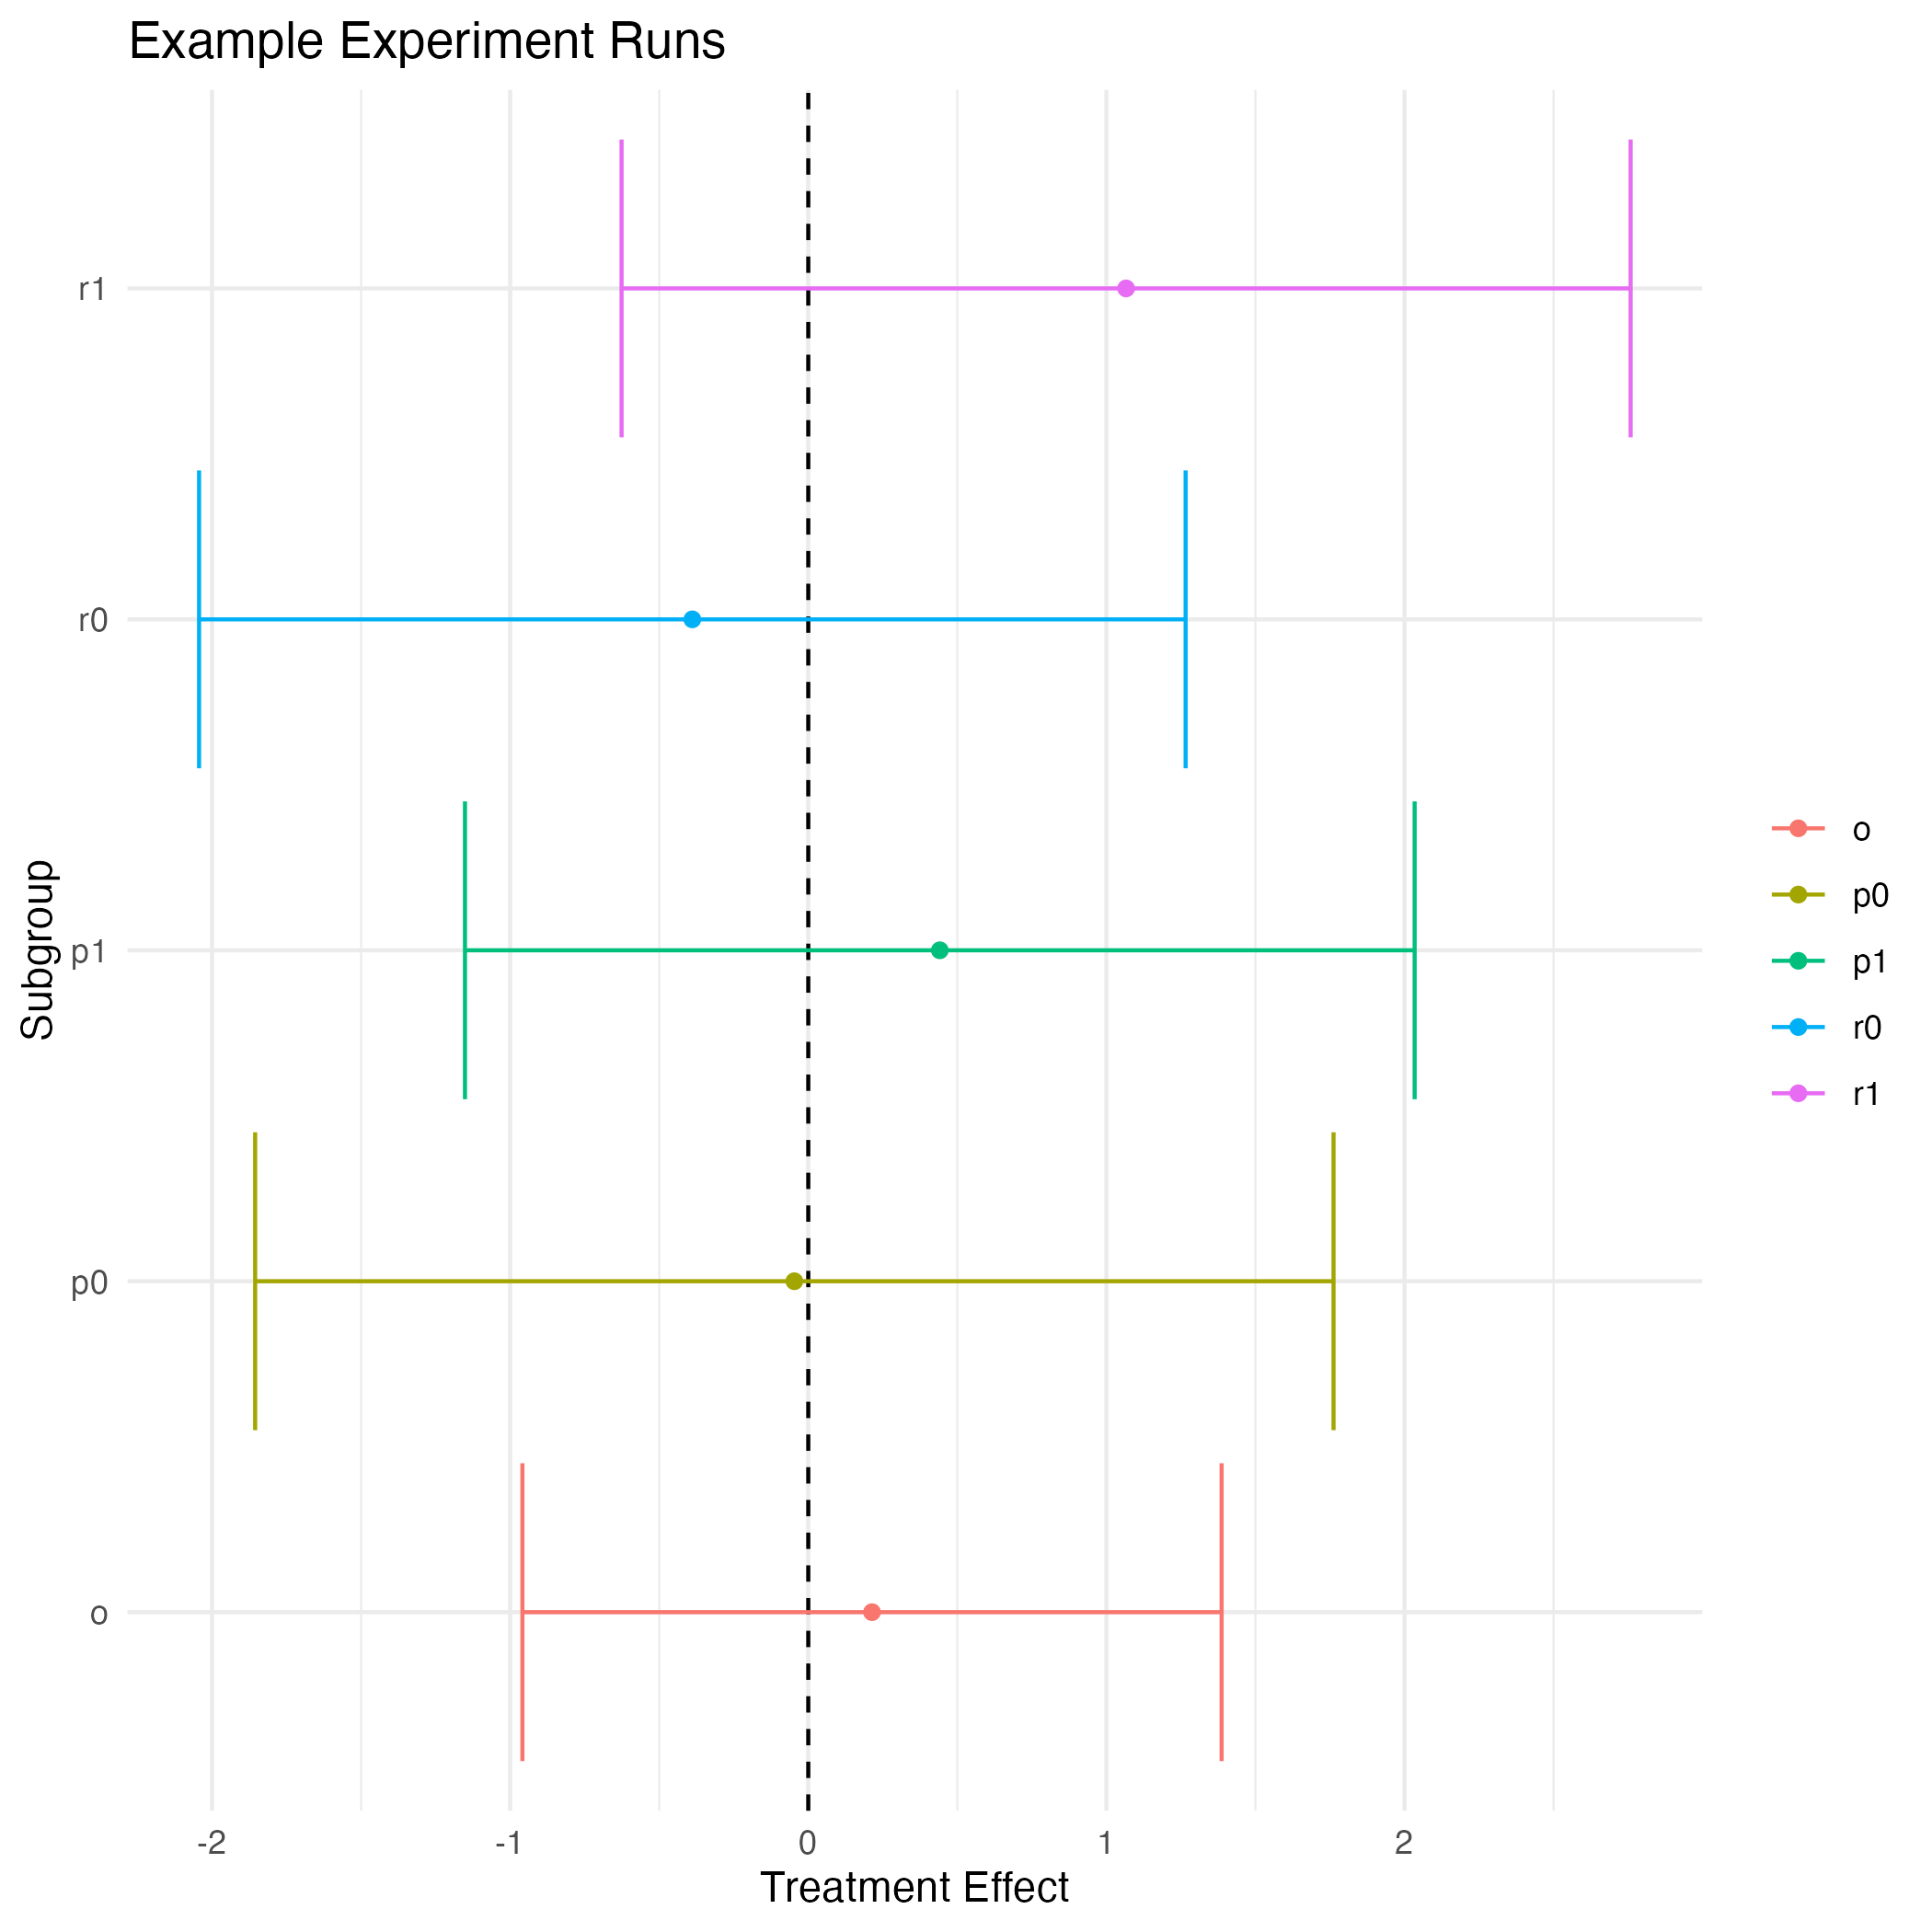
Treatment Effect Coefficient Plot Example
I think this is pretty cool, and another way of solving this type of problem. Programming with non-standard evaluation is a big topic, so I make no claims that this is the best possible way of doing this, but it does run reasonably quickly even on datasets much larger than the toy one here.
Consult the Programming with dplyr vignette for much more detail.↩︎