Intro
When running a randomized control trial (RCT), there is often concern about non-compliance. Subjects may drop out of the treatment or choose to go against the treatment assignment somehow. A plausible solution is to run an Intent To Treat (ITT) analysis. In this setting, we include every unit that has been randomized according to treatment assignment and ignore any non-compliance or dropout that might have occurred. These studies measure the average effect of being assigned to the treatment or control group. One result known from the literature (Gerber and Green 2012, Chapter 5) is that ITT estimates tend to be conservative.
A nice aspect of an ITT analysis is that, in principle, we are just taking a difference of means, and the difference of means has a regression interpretation. Programmatically, multiple outcome variables can lead to typing the same code lines multiple times and substituting out appropriate variables. Beyond leading to code smell, such an approach creates a complication for when we want to a) analyze results together and b) present results to others. This post shows two ways to take advantage of the tidyverse ecosystem to make ITT analyses simple and, hopefully, reasonably elegant.
Code
To follow along with this exercise, you’ll need to load these packages:
library(broom)
library(estimatr)
library(haven)
library(here)
library(tidyverse)
First, let’s create some simulated data. We will keep everything simple and presume that all of our variables are binary and a sample treatment vector.
set.seed(1014)

df <- data.frame(
  x1 = rbinom(100,1, prob = .5),
  x2 = rbinom(100, 1, prob = .5),
  x3 = rbinom(100,1, prob = .5),
  x4 = rbinom(100, 1, prob = .5),
  Z = sample(c(rep(1,50), rep(0,50)), 100, replace = F)
)
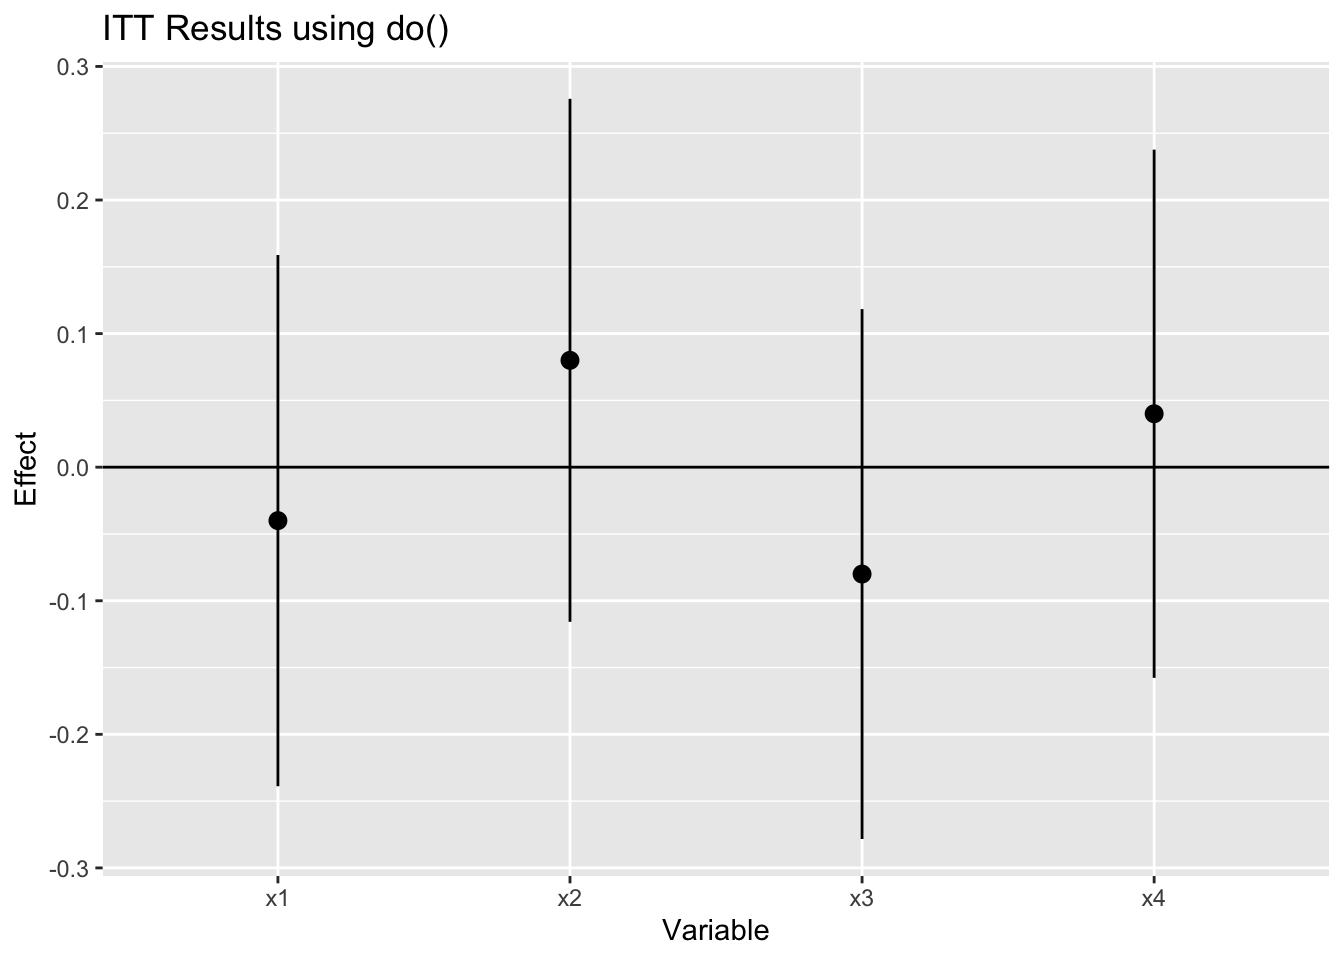
If I wanted to perform this task without repeatedly writing the same t-test, I would use the do() function in dplyr. The code would look something like the following.
# Option 1 using do()
df %>%
  # The following are some tricks I picked up from the internet
  # turn our data into long format so that we can group by each DV
  # in the index
  pivot_longer(!Z, "dv_name", "dv_value")%>%
  group_by(dv_name)%>%
  # A t-test is equivalent to a regression test
  # with one independent variable
  # provided we meet the assumptions of that variable
  # Here I'm using the broom::tidy() function to get the output of lm
  # into a nice format
  do(tidy(lm_robust(value ~ Z, data = ., se_type = "stata")))%>%
  mutate(p.value = round(p.value, 5))%>%
  filter(!grepl("nter", term))%>%
  # plot the coefficients
  ggplot(aes(dv_name, estimate))+
  geom_point()+
  geom_pointrange(aes(ymin = conf.low, ymax = conf.high))+
  geom_hline(yintercept = 0)+
  xlab("Variable")+
  ylab("Effect")+
  ggtitle("ITT Results using do()")
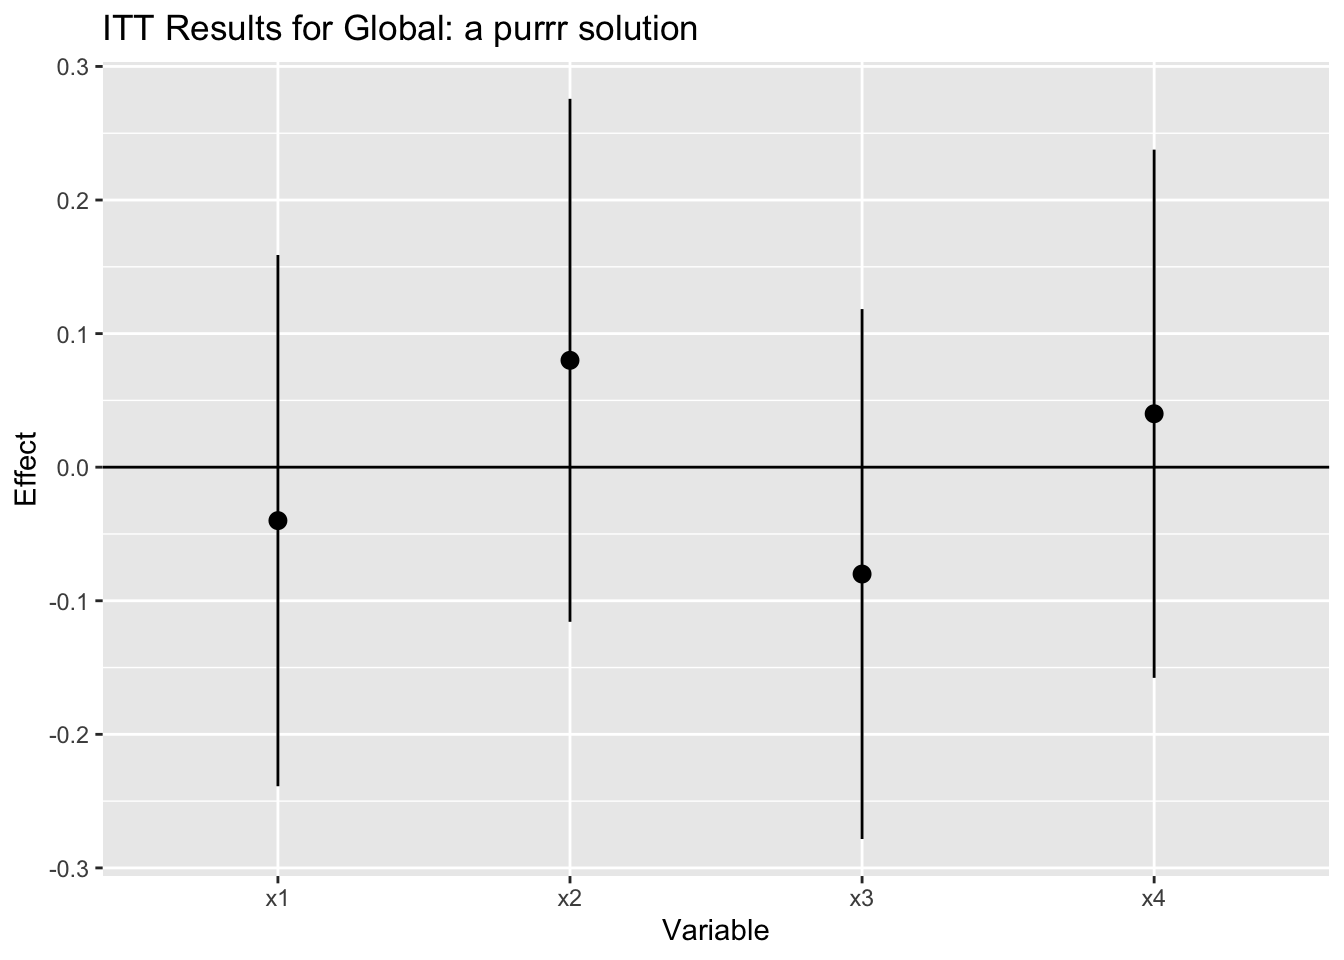
Unfortunately, that function has been scheduled for deprecation because other functions can do what do() does better. Entirely plausible, except that learning new functional patterns is a pain. Nevertheless, necessity is the mother of invention, or in this case, the mother of figuring out a way to do the same task with purrr.
# Option 2 do() happens to be deprecated now so instead
#here's a purrr solution
df %>%
  # We're sending a bunch of dvs to the map call
  # so we remove the non dvs
  select(-Z)%>%
  # call map on each dv
  map(~lm_robust(.x ~ Z, data = df))%>%
  # turn our results into a data frame
  map_dfr(~broom::tidy(.), .id = "source")%>%
  # deal with the stupid values of the p-values
  mutate(p.value = round(p.value, 5))%>%
  # Remove the intercept terms because we're interested
  # in the effect of the coefficient
  filter(!grepl("nter", term))%>%
  # plot the coefficients
  ggplot(aes(source, estimate))+
  geom_point()+
  geom_pointrange(aes(ymin = conf.low, ymax = conf.high))+
  geom_hline(yintercept = 0)+
  xlab("Variable")+
  ylab("Effect")+
  ggtitle("ITT Results for Global: a purrr solution")
Conclusion
Intent To Treat analysis is a common statistical concept and is regularly used in experimental and, with appropriate assumptions, observational contexts. In this post, I showed a neat way to compute multiple ITTs with the same treatment variable and store the results so that we can easily present our results. As I learn more about the purrr package, I am consistently impressed with how powerful functional programming can be for my analysis tasks.